Case study: where HorneSci's HST saves energy, and where it doesn't
On this page
The challengeThe methodWhere HST saves energy, and where it doesn'tNVIDIA H200: the more data changes, the more HST savesNVIDIA H100 and L40S: the gap a stopwatch missesApple M1 Max: 46% less energyAuditable to the sampleAbout HorneSciMeasure your ownHorneSci develops HST for sparse and incremental computation. With joules, it measured on real hardware where HST saves energy against an already optimized baseline, and where it does not.
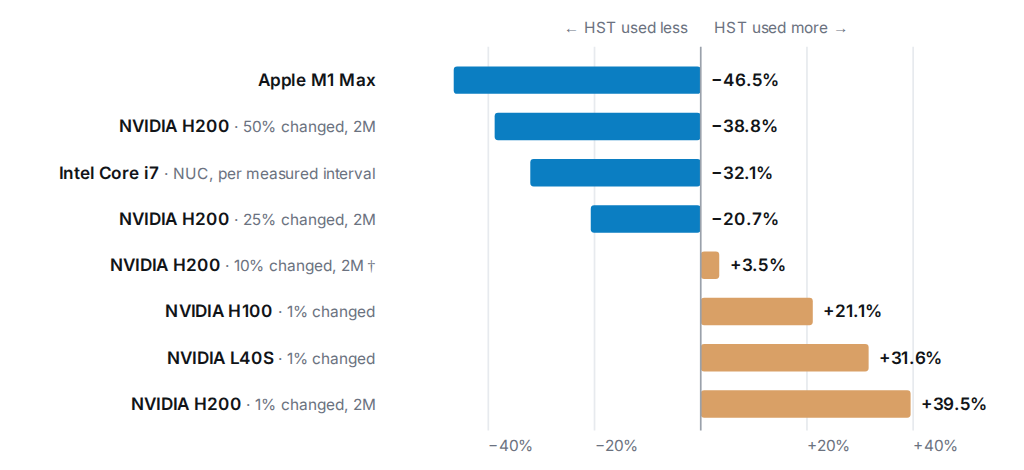
The result: on an NVIDIA H200 with half the data changing per update, HST used 38.8% less GPU energy and 29.5% less time. On Apple M1 Max it used 46% less energy per job (p = 0.0006). With only 1% of the data changing, the baseline used less energy on all three GPUs tested, and on the H100 a stopwatch would have missed it: HST finished 1.3% sooner but used 21% more GPU energy.
Download the full case study (PDF, 6 pages)
The challenge
Energy results are noisy: repeats of the same command can differ by 15% or more, enough to hide or invent a difference. HorneSci needed one fair method across GPUs, Apple silicon and Intel CPUs, against a baseline that was already optimized.
The method
joules compare measured each version's whole command:
- One warm-up, then 7 runs per side in alternating (ABBA) order, which reduces order bias (M1 Max and GPUs; the NUC used 6 phases per side).
- Idle power measured before and after.
- Medians and p-values for energy and time.
- Every run kept, in CSV and JSON, for audit.
Where HST saves energy, and where it doesn't
Each machine ran its own workload, so each bar compares HST only with its own baseline.
NVIDIA H200: the more data changes, the more HST saves
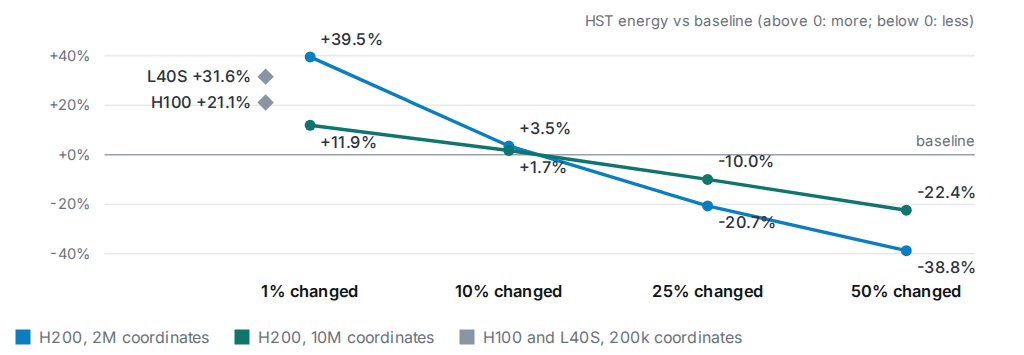
HST was tested with 1% to 50% of the data changing per update, at 2 million and 10 million coordinates. For this workload, the results suggest a crossover between 10% and 25% changed.
| Data changed per update | 2M · energy | 2M · time | 10M · energy | 10M · time |
|---|---|---|---|---|
| 1% ‡ | +39.5% | +10.6% | +11.9% | +2.6% |
| 10% ‡ | +3.5% † | +0.6% † | +1.7% † | −0.8% † |
| 25% | −20.7% | −13.3% | −10.0% | −5.2% * |
| 50% | −38.8% | −29.5% | −22.4% | −10.8% |
HST against the baseline, median of 7 runs each. † not statistically significant · * inconclusive (p = 0.053) · ‡ reported from summaries; the 25% and 50% cases were reconciled by HorneSci against raw data. Energy is whole-command GPU energy, excluding CPU energy. Each iteration resets the output and applies the same fixed delta, with changes grouped into eight-coordinate blocks. The GPU results compare HST Tile8x8 with an exact incremental CSC baseline, separate from cuSPARSE or a full application.
NVIDIA H100 and L40S: the gap a stopwatch misses
With 1% of the data changing, the baseline used less GPU energy on both GPUs. On the H100 the two finished almost together, yet HST used 21% more energy. Timing alone would not have shown it.
| 1% changed, 200k coordinates | Runtime | GPU energy | Energy above idle |
|---|---|---|---|
| NVIDIA H100 NVL | 2.016 → 1.990 s · −1.3% | 202.3 → 244.9 J · +21.1% | +54.2% |
| NVIDIA L40S | 2.577 → 2.893 s · +12.3% | 192.7 → 253.7 J · +31.6% | +133.4% |
Baseline → HST, median of 7 runs each. All differences significant (p ≤ 0.011).
Apple M1 Max: 46% less energy
HST finished the job in 12.2 seconds instead of 19.8, and used 133 joules instead of 249.
| Median per command | Baseline | HST | Change | p |
|---|---|---|---|---|
| Runtime | 19.821 s | 12.226 s | −38.3% | 0.000583 |
| Integrated sampled Combined CPU+GPU+ANE power | 249.165 J | 133.426 J | −46.5% | 0.000583 |
| Energy above idle | 47.216 J | 23.314 J | −50.6% | 0.053 |
The saving in energy above idle is not yet conclusive (p = 0.053).
Auditable to the sample
HorneSci kept the raw meter stream and audited it sample by sample. Eric Spencer found an extra GPU power line counted on Apple silicon when two samplers ran together. He reproduced it and proposed a fix; the corrected comparison reconciles all 1,529 samples one for one. WattOps shipped the fix in joules 0.8.0rc2.
The full case study has every machine's settings, run counts and p-values, and a shared-GPU test on a Tesla T4: download the PDF.
About HorneSci
HorneSci is a software and research company co-founded by Hunter Horne and Eric Spencer. It helps teams reduce repeated computation in existing software, updating results from changed inputs and measuring each approach against a defined baseline. HST is part of its work on sparse and incremental computation. Run sparse or incremental workloads? Talk to HorneSci: hornesci.com.
Measure your own
joules is free: one command measures any job on NVIDIA, AMD, Intel or Apple hardware, and joules compare runs the same fair A/B method used here. The benchmarking guide shows how.